Transportation Data Collection Program
- 9 min to read
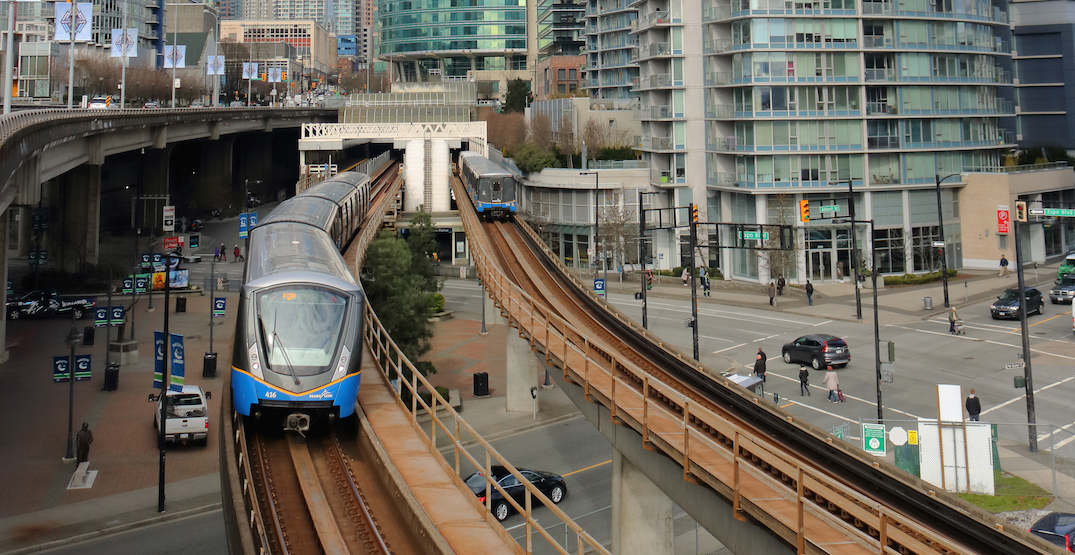
Vancouver, Canada
About the city. The increase in walking, cycling and transit trips comes despite the region’s population continuing to grow by 30,000 to 40,000 residents every year.
Goal
Collecting traffic data helps the City of Vancouver make smart traffic management decisions in terms of:
- Traffic-calming measures
- Walking and cycling improvements
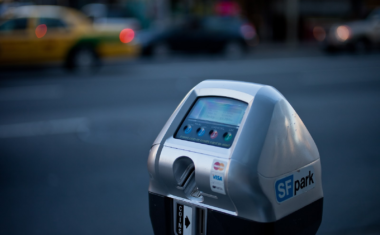
- Traffic and parking regulations
- Intersection and laning upgrades
- Traffic signal timing modifications
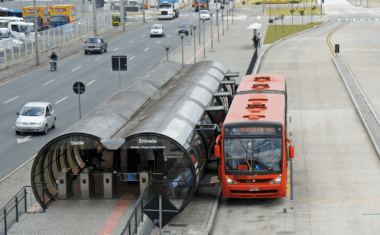
- Bus stop locations
Implementation period. It’s hard to find a specific year, but it seems that the first mention of the program is in 2017.
Fact
The Canada Line opened in 2009 and the city allowed bike and car share services to operate in Vancouver.
Solutions

Traffic data informs everything from city-wide transportation plans to neighbourhood traffic calming measures.
The City shares its traffic data with the public, so that everyone can be informed of what is happening in the city.
The methods can be categorised into these types:
- Permanent count stations
- Short-term count data
- Panel survey
Permanent count stations
Permanent count stations for pedestrians, bikes, and vehicles are used to monitor temporal traffic pattern changes around the city. They provide hourly count data.
https://www.google.com/maps/d/embed?mid=1TOlvw-mKn-XhZMU1efDC76yxgOKDx6eN
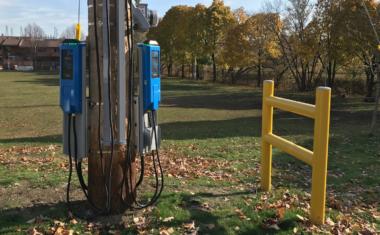
- Vehicle count stations
Located at approximately 35 locations, our permanent count stations record traffic volumes by lane on an hourly basis. Inductive loops, as well as magnetometers, detect moving metal objects above them and relay the detection to a nearby signal controller.
These counts are stored and undergo automatic quality checks where unreliable data is discarded for further review.
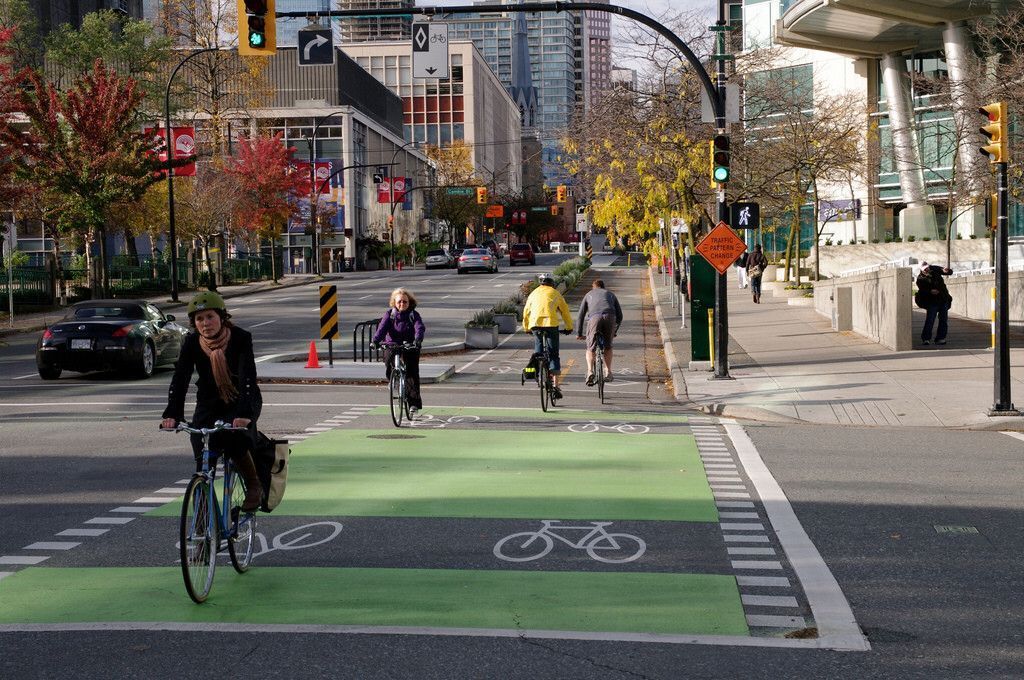
- Bike counters
Located at approximately 25 locations, our permanent bike count stations record traffic volumes by direction on a 15-minute basis. Inductive loops detect moving metal objects above them and relay the detection to a nearby count unit.
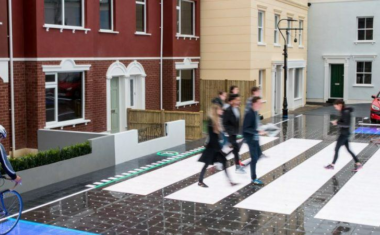
- Pedestrian counters
Located at approximately 10 locations, our permanent pedestrian count stations record traffic volumes by direction on a 15-minute basis. Overhead infrared detectors detect pedestrians as they pass below.
This program is operated in partnership with various Business Improvement Associations.
Short-term count data
Short-term count data is used to supplement permanent count data by providing specific metrics related to road user classification, turning counts, and speed data. Read below about the types of short-term counts.
- Pneumatic road tube counts
They count vehicular, cyclist, and micro-mobility traffic by placing rubber hoses on a road or bike path. As vehicles travel in either direction over the tubes, the counter records the air pulses.
Traffic counting is done mid-block between two intersections to give a total for each direction.
- Intersection turning movement counts
Conduct manual counts using electronic count boards at signalised and unsignaled intersections, typically during the morning and afternoon rush hours. They collect information for all traffic modes – vehicular, pedestrian, cyclist, and micro-mobility – at the intersection, including left turns, right turns, and through movements in every lane.
When longer time periods of data are required, mobile cameras are deployed to record the flow of traffic and allow the counts to be conducted on a computer at a later date.
- Active travel demographic counts
They conduct manual counts using electronic count boards midblock locations, typically during the morning and afternoon rush hours. For either bikes and micro-mobility or pedestrians, information such as the direction of travel, position, approximate age, and perceived gender is recorded.
Travel time study
-
To measure the effects of a project on the street network, they conduct before and after travel time studies. Routes in the area of the project are designed based on typical travel behaviour. Then they drive the route repeatedly, noting down the time at major intersections.
-
Speed capture.
Collect speed data by placing radar units on street poles. As vehicles travel in either direction in front of the unit, the counter determines the vehicle’s speed.
Speed capture is done mid-block between two intersections to reduce the dampening effect of signals.
Panel survey
The survey acts as a travel diary where individuals record the trips that they make on a given weekday. This trip data was then compared to previous panel surveys conducted from 2013 to 2019, allowing for analysis of transportation trends.
The panel survey helps to track progress towards Transportation 2040 goals for mode share targets (two-thirds of trips by sustainable modes by 2040) and vehicle-kilometres travelled (20% reduction from 2007 levels) as well as Climate Emergency goals (two-thirds of trips by sustainable modes by 2030).
Third-party data collection on city streets
They request that third parties interested in installing counting equipment on City streets contact us at [email protected] to provide the dates, times, locations, and equipment type.
Equipment installed by third parties that had not been agreed upon in writing by the City may be removed without notice.
Challenges
Problem. Is private info collected?
Solution. No personal information is collected as part of the City’s traffic data collection efforts in adherence to BC’s Freedom of Information and Protection of Privacy Act.
Team
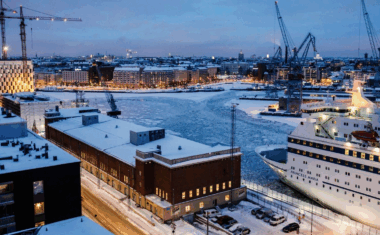
The City of Vancouver. Port and highway images are provided by the Ministry of Transportation and Infrastructure (MoTI).
If you notice an error or inaccuracy in our editorials, please email [email protected] so we can look into it.